
Measuring Polyarchy Across the Globe, 1900–2017
Abstract
This paper presents a new measure polyarchy for a global sample of 182 countries from 1900 to 2017 based on the Varieties of Democracy (V-Dem) data, deriving from an expert survey of more than 3000 country experts from around the world, with on average 5 experts rating each indicator. By measuring the five components of Elected Officials, Clean Elections, Associational Autonomy, Inclusive Citizenship, and Freedom of Expression and Alternative Sources of Information separately, we anchor this new index directly in Dahl’s (1971) extremely influential theoretical framework. The paper describes how the five polyarchy components were measured and provides the rationale for how to aggregate them to the polyarchy scale. We find that personal characteristics or ideological predilections of the V-Dem country experts do not systematically predict their ratings on our indicators. We also find strong correlations with other existing measures of electoral democracy, but also decisive differences where we believe the evidence supports the polyarchy index having higher face validity.
Introduction
Most scholars agree on the concept of democracy, which has informed empirical social science since Dahl (1971) coined the termed “polyarchy,” combining fair elections under universal suffrage with political liberties and alternative sources of information that enhance the democratic qualities of elections (e.g., Collier and Levitsky 1997; Møller and Skaaning 2010). Despite the popularity of Dahl’s concept of polyarchy, no measure has been available to capture it comprehensively. Based on 40 specific indicators from the Varieties of Democracy (V-Dem) dataset (Coppedge et al. 2018a), we provide nuanced measures of each of the core “institutional guarantees” in Dahl’s (1971, 1989, 1998) conceptualization, across a global set of 182 countries from 1900 to 2017,1 and a combined index of polyarchy with point estimates as well as measures of uncertainty.
Table 1 – Democracy indices compared | Para ver a tabela inteira baixe o paper: Teorell 2019 Article Measuring Polyarchy Across The Globe
We also show below that characteristics of V-Dem’s country experts systematically predict neither their ratings nor the differences between the polyarchy index scores and existing measures such as FH and Polity. Furthermore, such differences speak in favor of the face validity of our new measure.

Below we contrast polyarchy with other conceptions of democracy and outline V-Dem’s methodology, followed by a section on how we measure the components of polyarchy. The fifth section describes how the polyarchy index is aggregated from its components. We end by probing the validity of the underlying V-Dem data and indices, and our conclusions.
Polyarchy and Minimalist vs. Maximalist Conceptions of Democracy
.
Minimalist conception (Schumpeter) | Maximalist conception (Dahl) | Measurement approach | No. of indicators | |
|---|---|---|---|---|
Elected officials | X | X | Formative | 16 |
Free and Fair Elections | X | X | Reflective | 8 |
Associational Autonomy | X | X | Reflective | 6 |
Freedom of Expression and Alternative Sources of Information | X | Reflective | 9 | |
Inclusive Citizenship | X | Reflective | 1 |
Dahl’s polyarchy is often juxtaposed with Schumpeter’s (1942, p. 269) “minimal” conception that excludes any reference to political liberties such as freedom of expression and freedom of association. Arguing that “disqualifications on grounds of economic status, religion and sex [are] compatible with democracy,” Schumpeter (1942, pp. 244–5) also excluded extension of the suffrage (Møller and Skaaning 2010, pp. 268–9) and thus defined democracy as only the first, second, and (one aspect of the) third Dahlian institutional guarantees (see Table 2).
Defenses of more minimalist conceptions typically argue that the relationship between democracy and other factors such as civil liberties should be treated as empirical rather than definitional (e.g., Boix et al. 2012, p. 1527; Przeworski et al. 2000, p. 34). Yet, empirical considerations should not override compelling theoretical arguments. Democracy without the inclusion of most of “the people,” or without liberties that make elections meaningful, is an oxymoron. Accordingly, the majority of attempts to measure democracy in the world include suffrage and freedom of expression (e.g., Bollen 1980; Coppedge and Reinicke 1990; Hadenius 1992; Gasiorowski 1996; Mainwaring et al. 2001; Bowman et al. 2005; Coppedge et al. 2008).
Another prominent argument is that a non-electoral dimension such as freedom of expression should not be part of an election-centered measure of democracy. Why not simply refer to “elections, tout court” (e.g., Skaaning et al. 2015, p. 5) and hence reserve the term “electoral democracy” for a more minimalist notion (e.g., Møller and Skaaning 2010, pp. 268–171; Munck 2009, pp. 55–56)? Without denying the need for diminished subtypes for certain analytical purposes (Collier and Levitsky 1997), we maintain that Dahl provides the most comprehensive and most widely accepted theory of what constitutes an electoral democracy. “By this conception,” in Diamond’s (2002, p. 21) words, “democracy requires not only free, fair, and competitive elections, but also the freedoms that make them truly meaningful” (italics added). To avoid the “fallacy of electoralism” (Karl 1986), even election-centered notions of democracy need to take into account these non-electoral aspects (see also O’Donnell 2001).3
At the same time, some may find Dahl’s (1971) notion of polyarchy too minimalist since it refers to “democratic procedures, rather than to substantive policies or other outcomes that might be viewed as democratic” (Collier and Levitsky 1997, p. 433). There are also other procedural but still more demanding conceptualizations of democracy than “polyarchy,” such as the liberal tradition stressing strong rule of law and effective checks and balances limiting the use of executive power. However, we strive for a measure that aligns as closely as possible with the conception of democracy agreed upon by most scholars. This happens to be a combination of principles such as Suffrage, Free and Fair Elections, and some basic freedoms such as freedom of association and expression, but not including more demanding features such as checks and balances or the rule of law: i.e., Dahl’s (1971) polyarchy.
Nevertheless, V-Dem data are still useful for those who require more specific measures. Since we measure all components of polyarchy separately, our approach allows one to construct a more limited Schumpeterian measure or to test empirical relationships among specific components, such as how the extent of the suffrage relates to the degree of electoral competitiveness.
V-Dem’s Methodology
Drawing on the large literature on attempts to measure electoral democracy (e.g., Coppedge et al. 2011; Hadenius and Teorell 2005; Munck 2009; Munck and Verkuilen 2002), we argue that no extant measure fulfills all of the five essential criteria: (1) capturing all institutions in Dahl’s concept of polyarchy; (2) providing disaggregated data allowing for analyses of dimensionality and inquiries into what lower-level changes account for the shifts in higher-level indices; (3) covering a global sample of countries across long swathes of time; (4) using transparent data generating processes and aggregation rules; and (5) providing estimates of measurement uncertainty.
Extant measures meet only some of these criteria (for details, see Coppedge et al. 2017). Therefore, a new measure of polyarchy fulfilling all of them is needed. Three features of Varieties of Democracy (V-Dem) data make this possible.4 The first feature is radical disaggregation: principles of democracy are translated into detailed questions with well-defined response categories or measurement scales, 40 of which are here used to construct the polyarchy index. We thus measure each polyarchy component (save one: suffrage) with multiple indicators, enhancing reliability and providing a basis for tests of dimensionality.
Second, the bulk of the 40 indicators come from ratings by country experts, mostly academics who are from the 182 countries across the globe that V-Dem covers (see Appendix A).5 They are recruited based on academic or credentials as field experts of the country and substantive area they code, their seriousness of purpose, and their impartiality.6 The target is that at least five experts rate each indicator for each country and year going back to 1900, thus engaging more than 3000 experts in total.
As a third unique feature, V-Dem employs a custom-designed Bayesian item response theory model to estimate latent country-date traits from the expert ratings (see Pemstein et al. 2018). Patterns of cross-rater (dis)agreement are used to estimate variations in reliability and systematic differences in thresholds between ordinal response categories, in order to adjust estimates of the latent concept. To achieve cross-country and over-time comparability, we also use ratings by over 350 “lateral” coders (who rate multiple countries for a limited time period), over 400 “bridge” coders (who code the full time series for more than one country), and anchoring vignettes (a random selection of which have been answered by roughly 80% of the country experts).
Measuring the Parts: Five Components of Polyarchy
The measurement literature distinguishes between reflective (or “effect”) and formative (“cause” or “constitutive”) indicators. Reflective indicators are “symptoms” of the concept typically estimated by factor analysis, treating each indicator as the result of a common factor and a unique error component trait (Treier and Jackman 2008). Formative indicators reverse the equation, treating indicators as constitutive of the concept (Goertz 2006). While reflective indicators should be correlated and preferably load on a single factor in a factor analysis, there is no such expectation for formative indicators (Bollen 1989).7
Both the reflective (Bollen 1990; Treier and Jackman 2008) and the formative (Munck 2009; Goertz 2006) views of democracy measures have their advocates. Summarized in Table 2, we argue that the component of Elected Officials should, on theoretical grounds, be treated as constituted by its indicators, whereas the remaining four indicators are best treated as “effects” of their respective higher-level component. We proceed by discussing them in turn.
Formative Indicators: Elected Officials
Fig 2 – The components of the Elected Officials Index

There are six links of appointment/selection of the chief executive to account for: first and second, whether the head of state (a1) and/or head of government (a2) is directly elected (1) or not (0); third, the extent to which the legislature is popularly elected (b), measured as the proportion of legislators who are directly or indirectly elected (if the legislature is unicameral), or if the legislature is bicameral and the upper house is involved in the appointment of the chief executive, a weighted average of the proportion elected for each house;9 fourth and fifth, whether the head of state (c1) and/or head of government (c2) is appointed by the legislature (1), or the approval of the legislature is necessary for the appointment of the head of state (1), or not (0); and sixth, whether the head of government is appointed by the head of state (d = 1) or not (d = 0) (see Appendix B on exact question wordings and response categories).
In polities with unified executives (that is, when the head of state is also the head of government, Elgie 1998; Siaroff 2003), the complexity of this conceptual scheme reduces to the links a1 and b*c. Since these are considered perfect substitutes (either a directly elected president or a president elected by a directly elected parliament suffices), the index value is arrived at by taking the maximum value of the two. In dual systems, where there is both a head of state and a separate head of government, the chief executive is determined by comparing the two executives’ power over the appointment and dismissal of cabinet ministers. If the head of state and head of government share equal powers over the appointment and dismissal of cabinet ministers, the index averages across the degree to which they are directly or indirectly elected. The resulting construct is called the elected executive index (v2x_accex).
In the second step, the extent to which the legislature is elected (b) is also independently taken into account in order to penalize presidential systems with unelected legislatures, or legislatures with a large share of presidential appointees, for example. Assuming that the extent to which the chief executive and the legislature are elected work as partial substitutes, we average the two. The resulting index of Elected Officials (called v2x_elecoff) has a bimodal distribution (see Appendix Figure D1). The rare values falling between 1 and 0 are mostly bicameral systems where the upper house is indirectly elected, but also include cases such as Burma/Myanmar that (currently) has a unified executive with a president elected by a parliament in which only 75% of the seats are directly elected.10
Reflective Indicators: Bayesian Factor Analysis Indices
The other polyarchy components are arguably better measured by reflective indicators that partially substitute for one another. With the exception of “Inclusive Citizenship,” which we capture by the extension of the suffrage,11 we include multiple indicators for each component to allow both for a more comprehensive appraisal of each component, and for assessments of the extent to which they load on a single dimension. To test the latter proposition, we run a Bayesian factor analysis (BFA) model for each of the three components “Free and Fair Elections,” “Associational Autonomy,” and “Freedom of Expression and Alternative Sources of Information.” The results are reported in Appendix Tables A1–3. In each case, there is clear evidence for unidimensionality. We therefore construct a BFA index for each of these components in turn, accompanied by measures of uncertainty.12
The first, which Dahl (1998, p. 85) calls “free, fair, and frequent” elections, but which we designate “Clean Elections Index” (v2xel_frefair), is designed to capture the level of integrity of elections (e.g., Schedler 2002; Lehoucq 2003; Birch 2011; Kelley 2013; van Ham and Lindberg 2016). Eight indicators constitute this index, measuring the (a) autonomy and (b) capacity of the election administration body (EMB) to conduct well-run elections; and for each election, the extent of (c) registration irregularities, (d) vote buying, (e) ballot fraud and intentional irregularities, (f) government-induced intimidation of opposition candidates, (g) other types of election violence (not instigated by the government or ruling party), and (h) an overall assessment of whether the election overall was “free and fair.”13 The resulting index is bimodally distributed but with a skew towards observations with no elections (see Appendix Figure D4).14
The second component captures what Dahl (1998, p. 85) calls “Associational Autonomy” (or freedom of organization) using six indicators. The core of this construct is party-centered: are political parties free to form and operate, and are opposition parties allowed autonomy from the ruling regime? Equally important, and implying that there is an electoral aspect also to this component: are parties free to field candidates in national elections making them truly multiparty? Yet, Associational Autonomy in the political sphere additionally requires that there be no state repression, or barriers to the entry and exit, nor repression of a wider set of civil society organizations providing alternative means for voice and political activity. The resulting index (v2x_frassoc_thick), rescaled to 0–1 through the normal cumulative distribution function (cdf), is bimodally distributed (see Appendix Figure D5).15
Finally, Dahl’s concept of polyarchy includes two conspicuously non-electoral aspects: freedom of expression and access to alternative sources of information. Staying true to his widely accepted concept thus necessitates employing a core set of indicators capturing overall media freedom (Behmer 2009), such as active state censorship of print/broadcast media, media self-censorship, and harassment of journalists. In addition, it requires freedom of discussion in society at large, for both men and women (Skaaning 2009), and four indicators of media content to capture Dahl’s (1971, 1989, 1998) “alternative sources of information”: whether the media is biased against opposition parties and candidates, whether major print and broadcast outlets routinely criticize the government, and whether they represent a wide range of political perspectives, as well as general repression of cultural and academic expressions of political dissent. As argued above, one could question whether these really belong to a mostly electoral conception of democracy. We contend that Dahl (1989, 1998) himself provided the most viable answer to that question through his treatment of the notion of “enlightened understanding.” In essence, elections may be free and fair, and suffrage universal, yet without these non-electoral institutional guarantees in place, elections would still be meaningless if voters do not make an informed choice based on at least some minimal possibilities for collective deliberation. We therefore include both these guarantees using nine indicators but collapse them into one index called Freedom of Expression and Alternative Sources of Information (v2x_freexp_altinf) since they are very strongly correlated (results in Appendix Table A3). This is again converted to a probability (0–1) score by using the normal cdf, resulting in the distribution in Appendix Figure D7.
Measuring the Whole: Aggregating the Components
When determining how to aggregate the components into the overall polyarchy measure, the most important consideration is whether the five components should be seen as (partially) substitutable aspects of polyarchy, or if they form a set of necessary conditions. The literature is unfortunately divided on this matter. On one hand, there is a strong foundation for treating the components as necessary conditions (see Przeworski et al. 2000; Munck 2009; Boix et al. 2012). This argument holds that the degree of suffrage is not relevant if there is no Associational Autonomy, if the election results are completely fabricated, or if the executive is not elected. Similarly, by this logic, the freedom and fairness of elections should not count if only a tiny fraction of the population is enfranchised, and so on. What we call the Multiplicative Polyarchy Index (MPI) is following this “necessary conditions” logic:16

Measurement uncertainty is here taken into account by averaging the standard errors from the BFA estimates of Clean Elections, Associational Autonomy, and Freedom of Expression and Alternative Sources of Information. The resulting index is mostly distributed bimodally, as shown in the upper right quadrant of Fig. 3. The lower left quadrant of Fig. 3 contrasts the two aggregation rules, demonstrating that they discriminate at two different ends of the underlying scale. Thus, the additive index mostly differentiates among different degrees of democracy at the lower end of the multiplicative scale. Even when the multiplicative index is zero, the additive index can achieve as high a score as .77. Conversely, the multiplicative index mostly discriminates among countries already achieving high values on the additive scale. Thus, the multiplicative scale varies from .16 to .90 when the additive scale is above .80. This has potentially significant implications for the results of many empirical analyses.
Since both the multiplicative and the additive logic have support in the literature, and since they evidently have the virtue of discriminating at different ends of the spectrum of a foundational concept in political science that one would want to measure in full, we argue that the average of the two is the preferred solution to the aggregation problem. The V-Dem electoral democracy (polyarchy) index is thus constructed by averaging (1) and (2), or more precisely:18
Fig 4 – Polyarchy in 2017 (90% CIs)

Validating the Polyarchy Index
Following McMann et al. (2016), there are two fundamentally different ways in which we could provide positive evidence of validity. The first is to compare the ratings of different country experts for the same indicators, countries and years; the second is to compare these coder-level ratings, as well as the aggregated index at the country-year level, to other similar measures of electoral democracy from other datasets. Under the general heading of “convergent validity” (Campbell and Fiske 1959), agreement among coders or among datasets are both considered as evidence of measurement validity. Moreover, following Donchev and Ujhelyi (2014), understanding the sources of disagreement can provide an additional tool for assessing validity. In what follows, we pursue both strategies of validation.
Comparing Coders
Clean Elections | Associational Autonomy | Freedom of Expression and Alternative Sources of Information | |
|---|---|---|---|
Grand mean | 1.40*** (.038) | 2.23*** (.060) | 1.65*** (.059) |
Coder-random effects | .511*** (.015) | .409*** (.019) | .544*** (.013) |
Indicator-random effect | .802*** (.007) | .904*** (.009) | .591*** (.005) |
No. of indicators | 8 | 6 | 9 |
No. of experts | 1292 | 1863 | 1687 |
No. of observations | 288,910 | 438,269 | 725,251 |
Granted that country experts disagree at times, are there predictable patterns in that incongruity? Arguably, we should expect coders to disagree more, the more difficult the coding task (Steenbergen and Marks 2007; Coma and van Ham 2015). In V-Dem data, we may distinguish at least three sources of difficulty (McMann et al. 2016). First, all else equal, judging indicators of electoral democracy should be more difficult further back in time, when experts cannot rely as much on their academic and lived experience. Second, difficulty should increase when there is little independent information from which to form one’s judgment. Third, extreme conditions should be more easily identifiable than the “muddled middle”; hence, coders should be more likely to disagree at intermediate levels of whatever indicator they are assessing. This third expectation may work counter to the first to the extent that the situation in many countries was quite undemocratic aspects in the early years of the twentieth century.
Clean Elections | Associational Autonomy | Freedom of Expression and Alternative Sources of Information | |
|---|---|---|---|
(1) | (2) | (3) | |
Year | − .000 (.000) | − .001*** (.000) | − .001** (.000) |
Media access | − .003*** (.001) | − .003*** (.001) | − .003*** (.000) |
Level | .053*** (.011) | − .052*** (.010) | .030*** (.008) |
Level2 | − .112*** (.006) | − .097*** (.005) | − .083*** (.003) |
No. of coders | .006** (.003) | .010** (.005) | .019*** (.005) |
No. of indicators | 8 | 6 | 9 |
Adjusted R-squared | .289 | .331 | .334 |
No. of countries | 171 | 173 | 173 |
No. of observations | 49,390 | 80,450 | 139,046 |
As a final test comparing coder estimates, we assess whether coder characteristics from the V-Dem post-survey questionnaire systematically affect ratings following Dahlström et al. (2012). We control for gender (female = 1, male = 0); age (in years, also including the squared polynomial); level of education (PhD = 1, 0 = less than PhD); employment (1 = government, 0 = other); whether the expert was born in or resides in the country he or she is coding (1 = yes, 0 = no); and whether the expert is of “Western” origin or not. Additionally, we control for three potential sources of ideological bias: support for free market economy as a proxy for left-right leaning, support for two different normative understandings of democracy. The first we call the “conventional understanding,” which entails support for electoral and liberal democracy. The second we call the “alternative understanding,” which entails support for participatory, deliberative, or egalitarian types of democracy.22Appendix F provides the exact question wording for all the above. In order to fix comparisons across coders to the same countries and years, we also control for country- and year-fixed effects (results omitted).
Clean Elections | Associational Autonomy | Freedom of Expression and Alternative Sources of Information | ||||
|---|---|---|---|---|---|---|
(1) | (2) | (3) | (4) | (5) | (6) | |
Gender | − .079 (.050) | − .018 (.046) | − .012 (.041) | − .029 (.041) | − .060 (.041) | − .090*** (.033) |
Age | − .017 (.013) | − .029* (.015) | − .004 (.011) | .002 (.012) | .004 (.011) | .004 (.009) |
Age2 | .000 (.000) | .000** (.000) | .000 (.000) | − .000 (.000) | .000 (.000) | − .000 (.000) |
PhD education | − .037 (.056) | − .028 (.056) | − .020 (.039) | − .041 (.047) | − .039 (.038) | − .028 (.036) |
Government employee | − .105 (.088) | − .104 (.089) | .087 (.080) | .089 (.080) | − .085 (.077) | .082 (.059) |
Born in country | .180*** (.065) | .145** (.070) | .085* (.044) | .082 (.053) | .060 (.051) | .068 (.050) |
Resides in country | .020 (.062) | .005 (.063) | − .064* (.036) | − .058 (.045) | .027 (.048) | − .023 (.043) |
Born in Western country | − .021 (.070) | .007 (.084) | − .083 (.051) | − .004 (.060) | − .041 (.063) | − .041 (.055) |
Free market support | .019 (.021) | .030 (.023) | .022* (.013) | − .007 (.015) | .031* (.016) | .006 (.019) |
Conventional understanding of democracy | − .006 (.023) | − .014 (.053) | − .001 (.015) | − .042 (.034) | − .002 (.016) | − .022 (.032) |
Alternative understanding of democracy | − .008 (.022) | .013 (.050) | − .029* (.015) | .035 (.038) | − .033** (.016) | − .016 (.031) |
Western country | .135* (.072) | − .319*** (.085) | − .174 (.129) | |||
Born in Western country ×Western country | − .084 (.121) | .115 (.091) | .125 (.114) | |||
Openness to trade | .024* (.014) | − .020* (.010) | − .002 (.010) | |||
Free market support × openness to trade | − .006* (.003) | .002 (.003) | − .002 (.003) | |||
Conventional democracy score | 1.921*** (.322) | 2.890*** (.315) | 2.819*** (.261) | |||
Conventional understanding × score | .027 (.085) | .056 (.060) | .060 (.049) | |||
Alternative democracy score | 1.835*** (.356) | − .243 (.349) | .903*** (.258) | |||
Alternative understanding × score | − .075 (.075) | − .105* (.062) | − .025 (.045) | |||
Country-fixed effects? | Y | N | Y | N | Y | N |
R-squared | .211 | .458 | .104 | .299 | .161 | .545 |
No. of countries | 173 | 147 | 174 | 149 | 174 | 149 |
No. of observations | 245,039 | 160,998 | 383,763 | 228,557 | 635,567 | 370,224 |
Models 2, 4, and 6 test for another type of coder bias that Bollen and Paxton (2000, p. 72) label “situational closeness.” This is the idea that “judges will be influenced by how situationally and personally similar a country is to them. “Accordingly, strong believers in the free market would have a specific tendency to rate countries with free markets better. Similarly, situational closeness bias implies that believers in other conceptions of democracy rank countries more proximate to their ideals more favorably also on the electoral indicators. Finally, this kind of bias could manifest in such a way that even if Western coders displayed no systematic bias for their countries, bias might be directed towards non-Western countries. We test this by controlling for interaction effects between particular coder and country characteristics.23 None of these interaction effects are, however, significant at conventional levels. The dominant pattern is thus that situational closeness does not introduce bias in the V-Dem experts’ ratings of electoral democracy.
Comparing Measures
Fig 5 – Comparing polyarchy with Alternative Electoral Democracy Indices. Note: The black dotted lines are smoothed lowess regression lines of best fit
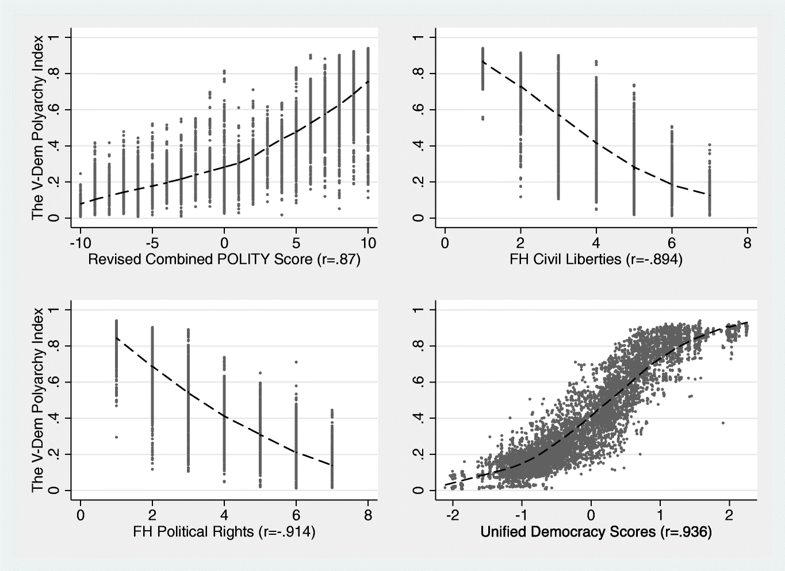
Nonetheless, the polyarchy index regularly produces scores that differ from extant measures. Some pertinent examples of this were highlighted already in Fig. 1, where we argued that the V-Dem measure outperforms extant measures in terms of face validity. In Figs. 6 and 7, we portray the country differences more systematically by plotting the average polyarchy scores against the average Polity and FH scores, taking into account every country year that exists in both respective datasets.24 The diagonal indicates where there is no difference between the measures, implying that V-Dem polyarchy rates electoral democracy higher than the alternative measures for cases above the line, but lower for the ones below the line. There are a few cases above the diagonal (the top five are highlighted in red). Three cases appear on this list for both Polity and Freedom House: the German Democratic Republic (GDR), Turkmenistan, and Uzbekistan. The most important reason that V-Dem tends to score those countries higher than both Polity and Freedom House is that Elected Officials and Suffrage, which both score high in these cases, are allowed to exert an independent influence on the polyarchy scores.
Fig 6 – Comparing average polyarchy with Polity scores

Fig 7 – Comparing average polyarchy with FH scores

The bulk of cases, however, appear below the line (the average difference with Polity is − .13, with FH − .06), meaning that the polyarchy index is a more demanding standard on average than the alternative measures. Several of the most diverging cases for Polity are presented and discussed already in Fig. 1. (Colombia ranks 12th in terms of how far it falls below the diagonal, so it is not highlighted in Fig. 6.) But for Freedom House, there is an additional conspicuous pattern: several of the countries where FH is significantly larger than polyarchy are relatively small states, such as Barbados, the Dominican Republic, Montenegro, Papua New Guinea, and the Solomon Islands. What drags down these countries in particular in the polyarchy index is the low quality of their elections as compared to their FH ratings.
In sum, the polyarchy index is positively correlated with extant measures of democracy, but we also find discrepancies where we believe polyarchy, by incorporating all of Dahl’s five components and by relying on more fine-grained case expertise, provides a more nuanced and accurate picture of the state of electoral democracy.25
Conclusion
This paper presents a new index of polyarchy that has several advantages over extant measures. The V-Dem polyarchy index is firmly anchored in the most established canon of positive democratic theory. It is based on a unique knowledge base and data-generating process that addresses thorny issues regarding cross-country and cross-rater comparability while also providing measures of uncertainty. Moreover, its five components with their respective indices, and their constituent 40 indicators, make it possible to drill down into what exactly drives changes in scores of country-specific trajectories. This transparency and detail enables researchers to pursue novel research agendas such as the relationship of economic development, democratic peace, human development, corruption, or state capacity to disaggregated components of democracy. The index and its construction also allow end users to choose between two variants representing the two main traditions in terms of viewing Dahl’s institutions as either necessary or partly compensatory conditions of democracy, and to work with thinner conceptions of electoral democracy when they are more appropriate for their research questions.
Finally, several tests of validity of the new polyarchy index strengthen our belief that it is by and large not driven by biases stemming from coder characteristics or ideological predilections. There is some amount of coder agreement for individual country-year indicators but we have demonstrated that deviations from that pattern can be meaningfully understood in predictable ways that do not necessarily undermine the validity of the index. We also find strong correlations with other existing measures of electoral democracy, but also decisive differences where we believe the evidence supports that the polyarchy index has higher face validity.
We hope that this new resource will prove useful to scholars in bringing forward new and more robust knowledge on the causes and consequences of democratization. While this new measure will not solve all issues with democracy research, we hope it will alleviate some of them and open up new research agendas.
Footnotes
- 1.
All figures presented in this paper are drawn from v8 of the V-Dem dataset (Coppedge et al. 2018a), but the coder-level analyses presented in Tables 3, 4, and 5 draw on an earlier version (v5). Although the polyarchy index with this release has been extended back to 1789 in a sample of long-established polities in the world (Knutsen et al. 2018), here we rely only on the data from 1900 onward that use the original V-Dem methodology of at least 5 experts coding each country (see more below).
- 2.
The two requirements from Dahl (1971, p. 3) missing in Dahl (1998, p. 85) are as follows: “Eligibility for public office” and “Institutions for making government policies depend on votes and other expressions of preference.” The first can be excluded because eligibility and suffrage tend to go hand in hand (Coppedge and Reinicke 1990, p. 53), and also because several of the aspects of “Associational Autonomy” capture the eligibility criteria. The second can be dropped because it is a summary proxy for the other requirements. We collapse the remaining sixth guarantee “Alternative Sources of Information” with “Freedom of Expression” since the former is theoretically closely connected to, and as we show, empirically indistinguishable from, the latter.
- 3.
- 4.
- 5.
V.7 of the data. V-Dem data code a “country” throughout its history also as a semi-sovereign unit (since 1900), including most colonies, and also some current semi-independent territories.
- 6.
The questionnaire is subdivided into 11 different areas of expertise, and most experts code a cluster of three such areas (see Coppedge et al. 2018c for recruitment and processing protocols).
- 7.
Bollen (2011) distinguishes between two types of formative indicators: “cause” indicators and “composite” indicators. In both, the concept to measure is on the left-hand side of the equation. The formative indicators we describe here are examples of what Bollen terms “composite” indicators.
- 8.
Counting dismissal powers would introduce “bias” in favor of parliamentary systems. Presidential systems typically have no recall vote and the assembly-independent Swiss system lacks power to dismiss the cabinet.
- 9.
The shares of directly and indirectly elected legislators are coded separately and then added as a weighted sum. The weights are defines as 1/s, where s is the number of stages in the election process. Due to data limitations, we have decided to exclude indirect electoral systems with more than two stages; hence, the weight for directly elected legislators is 1/1 = 1, and for indirectly elected legislators 1/2.
- 10.
The index does not take into account the extent to which non-elected “accountability groups” (such as the military) may affect dismissal or can veto decisions. There are V-Dem indicators of veto and dismissal powers (see Teorell and Lindberg 2018), but we have not found a non-arbitrary way of computing the size of the penalty these should incur.
- 11.
This factual indicator (v2x_suffr) measuring the proportion of adult citizens eligible to vote (see Appendix B, section D, for details) is bimodally distributed (see Appendix Figure C6).
- 12.
See Coppedge et al. 2018c for details of the BFA’s and technical aspects of constructing the indices.
- 13.
If legislative and presidential elections were held concurrently, the measures pertain to both of them. If multiple elections (or rounds of elections) were held in the same year, each election is measured separately. For present purposes, the estimates have been averaged across multiple elections within a year to arrive at country election-year estimates.
- 14.
Since this index is observed only for election years, we interpolate between elections until there is an “electoral interruption,” defined as either (i) the dissolution, shutdown, replacement, or in any sense termination of the elected body (such as after coups or violent takeovers of the government) or (ii) an elected body which, while still intact or in place, is no longer appointed through (direct) elections (as after an autogolpe). We convert the index score to a probability (0–1) score by using the normal cumulative distribution function (cdf) and substitute all values with zero during non-electoral periods (i.e., prior to the first election or after an electoral interruption) (see Figure D3 (Appendix D)).
- 15.
This is only observed during elections years. We use the same procedure described in the footnote above.
- 16.
Taking the minimum is the other aggregation rule typically considered for capturing a set of necessary conditions (Bowman et al. 2005, p. 956; Goertz 2006, pp. 111–115). With dichotomous measures, these two alternatives reduce to the same thing, but not with graded indicators. The relative virtue of multiplication is that it combines information from all constitutive elements and hence relies on, and retains, more information.
- 17.
We thank Carl-Henrik Knutsen for intellectual assistance in designing this aggregation rule. The assignment of weights can also be supported empirically by fitting a single-factor BFA to the components on the full set of observations. In a BFA, the fit to a one-dimensional model is decent, but with Elected Officials and Suffrage having weaker loadings (at .651 and .457, respectively, compared to .837, .978, and .948 for Clean Elections, Associational Autonomy, and Expression). The average loadings of Elected Officials and Suffrage are thus roughly half that of Associational Autonomy, Freedom of Expression, and Associational Autonomy, suggesting, as argued by Coppedge and Reinicke (1990) and Coppedge et al. (2008), a two-dimensional solution. This is also suggested by the correlations between components, as shown in Appendix Table A4, particularly when only focusing on election years.
- 18.
The measurement uncertainty is propagated into this overall index by averaging the standard errors from the API and MPI. In Appendix E, we report on simulations showing that, on average, the overall index value deviates by only .050 from the proposed version depending on what weights are awarded to the individual sub-components of the additive index (API). The average standard deviation depending on what weight is applied to the average (API) vs. multiplication (MPI) component is .081. Although the outcome is thus more sensitive to this latter choice (as Fig. 3 indicates), the results are still substantially similar.
- 19.
Four exceptions, pertaining to how we determine the chief executive in dual executives, have been omitted from the following analysis because they only apply to a partial sample of country-years, and only provide auxiliary information. The remaining factual indicators were coded in-house and could thus not be assessed in terms of coder disagreement.
- 20.
v2meaccess: “Approximately what percentage (%) of the population has access to any print or broadcast media that are sometimes critical of the national government?” (see Coppedge et al. 2018c).
- 21.
In particular, lateral coding performed by a large number of coders for many countries for 2012 produces a higher number of coders for most countries for that particular year.
- 22.
This grouping of the five principles of democracy is supported by a principal component factor analysis run at the coder level (results available upon request).
- 23.
Hence, we must drop the country-fixed effects from these models. Western countries are defined as Western European countries together with the USA, Canada, Australia, and New Zealand. Openness to trade is the sum of imports and exports as a percentage of GDP (data from Correlates of War). Conventional democracy score is the average value of the V-Dem indices of electoral and liberal democracy. Alternative democracy score is the average value of the V-Dem indices of participatory, deliberative, and egalitarian democracy.
- 24.
Results for the Unified Democracy Scores, available on request, are very similar.
- 25.
In further tests, available upon request, we also find that the differences across datasets cannot be easily explained by features of the V-Dem data-generating process such as the composition and number of coders for particular countries.
Notes
Acknowledgements
We performed simulations and other computational tasks using resources provided by the Swedish National Infrastructure for Computing (SNIC), grants 2016/1-382 and 2017/1-68. We specifically acknowledge the assistance of Johan Raber.
Funding Information
This research project was supported by Riksbankens Jubileumsfond, Grant M13-0559:1, PI: Staffan I. Lindberg; by Swedish Research Council, Grant 2012-5562, PI: Staffan I. Lindberg & Jan Teorell; by Knut & Alice Wallenberg Foundation Grant 2013.0166 to Wallenberg Academy Fellow Staffan I. Lindberg; by European Research Council, Grant 724191, PI: Staffan I. Lindberg; as well as by internal grants from the Vice-Chancellor’s office, the Dean of the College of Social Sciences, and the Department of Political Science at University of Gothenburg. Jan Teorell also wishes to acknowledge support from the Wenner-Gren Foundation and the Fernand Braudel Senior Fellowship at the European University Institute, Florence, which made it possible for him to work on this paper. Michael Coppedge acknowledges leave funding from the College of Arts and Letters at the University of Notre Dame in 2017.
Supplementary material
References
- Behmer M. Measuring media freedom: approaches of international comparison. In: Czepek A, Hellwig M, Novak E, editors. Press freedom in Europe: concepts and conditions. Bristol: Intellect; 2009. p. 23–34.
- Bejarano, AM, Leongómez EP. From ‘restricted’ to ‘besieged’: the changing nature of the limits to democracy in Colombia, Kellogg Institute Working Paper #296- April 2002; 2002.
- Birch S. Electoral malpractice. New York: Oxford University Press; 2011.
- Boix, C, Miller M, Rosato S. A complete data set of political regimes, 1800-2007. Comp Polit Stud. 2012;46(12):1523–54.
- Bollen K. Issues in the comparative measurement of political democracy. Am Sociol Rev. 1980:370–90.
- Bollen K. Structural equations with latent variables. New York: Wiley; 1989.
- Bollen K. Political democracy: conceptual and measurement traps. Stud Comp Int Dev. 1990;25(1):7–24.
- Bollen KA. Evaluating effect, composite, and causal indicators in structural equation models. MIS Q. 2011;35(2):359–72.
- Bollen K, Paxton P. Subjective measures of liberal democracy. Comp Polit Stud. 2000;33(1):58–86.
- Bowman K, Lehoucq F, Mahoney J. Measuring political democracy: case expertise, data adequacy, and central America. Comp Polit Stud. 2005;38(8):939–70.
- Campbell DT, Fiske DW. Convergent and discriminant validation by the multitrait-multimethod matrix. Psychol Bull. 1959;56:81–105.
- Case W. New uncertainties for an old pseudo-democracy: the case of Malaysia. Comp Polit. 2004;37(1):83–104.
- Collier D, Levitsky S. Democracy with adjectives: conceptual innovation in comparative research. World Polit. 1997;49(3):430–51.
- Coma FM, van Ham C. Can experts judge elections? Testing the validity of expert judgments for measuring election integrity. Eur J Polit Res. 2015;54(2):305–25.
- Coppedge M, Reinicke W. Measuring polyarchy. Stud Comp Int Dev. 1990;25(1):51–72.
- Coppedge M, Alvarez A, Maldonado C. Two persistent dimensions of democracy: contestation and inclusiveness. J Polit. 2008;70(3):335–50.
- Coppedge M, Gerring J, Altman D, Bernard M, Fish S, Hicken A, et al. Conceptualizing and measuring democracy: a new approach. Perspect Polit. 2011;9(2):247–267.
- Coppedge M, Lindberg SI, Skaaning S-E, Teorell J. Measuring high level democratic principles using the V-Dem data. Int Polit Sci Rev. 2016;37(5):580–93. Online first. https://doi.org/10.1177/0192512115622046.
- Coppedge M, Gerring J, Lindberg SI, Skaaning S-E, Teorell J. V-Dem comparisons and contrasts with other measurement projects. University of Gothenburg, Varieties of Democracy Institute: Working Paper No. 45; 2017.
- Coppedge, M, Gerring J, Knutsen CH, Lindberg SI, Skaaning S-E, Teorell J, Altman D, Bernhard M, Fish MS, Cornell A, Dahlum S, Gjerløw H, Glynn A, Hicken A, Krusell J, Lührmann A, Marquardt KL, McMann K, Mechkova V, Medzihorsky J, Olin M, Paxton P, Pemstein D, Pernes J, von Römer J, Seim B, Sigman R, Staton J, Stepanova N, Sundtröm A, Tzelgov E, Wang Y, Wig T, Wilson S, Ziblatt D. V-Dem Country-Year Dataset v8. Varieties of Democracy (V-Dem) Project. 2018a.
- Coppedge, M, Gerring J, Knutsen CH, Lindberg SI, Skaaning S-E, Teorell J, Altman D, Bernhard M, Cornell A, Fish MS, Gjerløw H, Glynn A, Hicken A, Krusell J, Lührmann A, Marquardt KL, McMann K, Mechkova V, Olin M, Paxton P, Pemstein D, Seim B, Sigman R, Staton J, Sundtröm A, Tzelgov E, Uberti L, Wang Y, Wig T, Ziblatt D. V-Dem Codebook v8. Varieties of Democracy (V-Dem) Project. 2018b.
- Coppedge, M, Gerring J, Knutsen CH, Lindberg SI, Skaaning S-E, Teorell J, Krusell J, Marquardt KL, Pemstein D, Pernes J, Stepanova N, Tzelgov E, Wang Y, Medzihorsky J, Wilson S. V-Dem Methodology v8. Varieties of Democracy (V-Dem) Project. 2018c.
- Dahl R. Polyarchy. New Haven: Yale University Press; 1971.
- Dahl R. Democracy and its critics. New Haven: Yale University Press; 1989.
- Dahl R. On democracy. New Haven: Yale University Press; 1998.
- Dahlström C, Victor L, Jan T. Public administrations around the world. In: Holmberg S, Rothstein B, editors. Good government: the relevance Of political science. Cheltenham: Edward Elgar; 2012.
- Diamond L. Thinking about hybrid regimes. J Democr. 2002;13:21–35.
- Donchev D, Ujhelyi G. What do corruption indices measure? Econ Polit. 2014;26:309–31.
- Elgie R. The classification of democratic regime types: conceptual ambiguity and contestable assumptions. Eur J Polit Res. 1998;33:219–38.
- Gasiorowski M. An overview of the political regime change dataset. Comp Polit Stud. 1996;29(4):469–83.
- Gibson JL, Gouws A. Overcoming intolerance in South Africa. New York: Cambridge University Press; 2003.
- Goertz G. Social science concepts: a user’s guide. Princeton: Princeton University Press; 2006.
- Hadenius A. Democracy and development. Cambridge: Cambridge University Press; 1992.
- Hadenius A, Teorell J. Assessing alternative indices of democracy, Concepts & methods Working Papers 6, IPSA, August 2005.
- Karl T. Imposing consent? Electoralism versus democratization in El Salvador. In: Drake P, Silva E, editors. Elections and democratization in Latin America, 1980-1985. San Diego: Center for Iberian and Latin American Studies; 1986. p. 9–36.
- Kelley J. Monitoring democracy: when international election observation works, and why it often fails. New Jersey: Princeton University Press; 2013.
- Keyssar A. The right to vote: the contested history of democracy in the United States. Revised edition. New York: Basic Books; 2000.
- Knutsen CH, Teorell J, Cornell A, Gerring J, Gjerløw H, Skaaning S-E, et al. Introducing the historical varieties of democracy dataset: patterns and determinants of democratization in the long 19th century. V-Dem Working Paper No. 65. University of Gothenburg: Varieties of Democracy Institute; 2018.
- Lehoucq F. Electoral fraud: causes, types, and consequences. Annu Rev Polit Sci. 2003;6:233–56.
- Lehoucq F, Molina I. Stuffing the ballot box: fraud, electoral reform, and democratization in Costa Rica. Cambridge: Cambridge University Press; 2002.
- Lindberg SI, Coppedge M, Gerring J, Teorell J. V-Dem: a new way to measure democracy. J Democr. 2014;25(3):159–69.
- Mainwaring S, Brinks D, Pérez-Liñán A. Classifying political regimes in Latin America, 1945–1999. Stud Comp Int Dev. 2001;36(1):37–65.
- Marquardt KL, Pemstein D. IRT models for expert-coded panel data. University of Gothenburg, Varieties of Democracy Institute: Working Paper No. 41. January 2017; 2017.
- Marshall M, Gurr T, Jaggers K. Polity IV project: political regime characteristics and transitions, 1800–2006. 2014. http://home.bi.no/a0110709/PolityIV_manual.pdf. Accessed 9 Apr 2015.
- McMann K, Pemstein D, Seim B, Teorell J, Lindberg S. Strategies of validation: assessing the varieties of democracy corruption data, V-Dem Institute Working Paper Series 2016:23, The Varieties of Democracy Institute, University of Gothenburg; 2016.
- Miller M. Democratic pieces: autocratic elections and democratic development since 1815. Br J Polit Sci. 2013;45:501–30.
- Møller J, Skaaning S-E. Beyond the radial delusion: conceptualizing and measuring democracy and non-democracy. Int Polit Sci Rev. 2010;31(3):261–83.
- Munck G. Measuring democracy: a bridge between scholarship & politics. Baltimore: The Johns Hopkins University Press; 2009.
- Munck G, Verkuilen J. Conceptualizing and measuring democracy: evaluating alternative indices. Comp Polit Stud. 2002;35(1):5–34.
- O’Donnell G. Democracy, law, and comparative politics. Stud Comp Int Dev. 2001;36(1):7–36.
- O’Donnell G, Schmitter P. Transitions from authoritarian rule: tentative conclusions about uncertain democracies. Baltimore: The Johns Hopkins University Press; 1986.
- Pemstein D, Meserve S, Melton J. Democratic compromise: a latent variable analysis of ten measures of regime type. Polit Anal. 2010;18:426–49.
- Pemstein D, Marquardt KL, Tzelgov E, Wang Y-t, Krusell J, Miri F. The V-Dem measurement model: latent variable analysis for cross-national and cross-temporal expert-coded data. University of Gothenburg, Varieties of Democracy Institute: Working Paper 21 (3rd ed.), April 2018; 2018.
- Przeworski A, Alvarez M, Antonio Cheibub J, Limongi F. Democracy and development: political institutions and well-being in the world, 1950–1990. Cambridge: Cambridge University Press; 2000.
- Schedler A. The menu of manipulation. J Democr. 2002;13(2):36–50.
- Schedler A. Judgment and measurement in political science. Perspect Polit. 2012;10(1):21-36.
- Schumpeter J. Capitalism, socialism & democracy. New York: George Allen & Unwin; 1942.
- Siaroff A. Comparative presidencies: the inadequacy of the presidential, semi-presidential and parliamentary distinction. Eur J Polit Res. 2003;42:287–312.
- Skaaning S-E. Measuring civil liberty: an assessment of standards-based data sets. Rev Cienc Polít. 2009;29(3):721–40.
- Skaaning S-E, Gerring J, Bartusevicius H. A lexical index of democracy. Comp Polit Stud. 2015;48(12):1491–525.
- Steenbergen M, Marks G. Evaluating expert judgments. Eur J Polit Res. 2007;46:347–66.
- Teorell J, Lindberg S. Beyond democracy-dictatorship measures: a new framework capturing executive bases of power, 1789–2016. Perspect Polit. 2018; forthcoming.
- Treier S, Jackman S. Democracy as a latent variable. Am J Polit Sci. 2008;52(1):201–17.
- van Ham C, Lindberg. Choosing from the menu of manipulation: explaining incumbents’ choices of electoral manipulation tactics, University of Gothenburg, V-Dem Institute: V-Dem Working Paper Series, No. 26; 2016.
Copyright information
Open Access | This article is distributed under the terms of the Creative Commons Attribution 4.0 International License (http://creativecommons.org/licenses/by/4.0/), which permits unrestricted use, distribution, and reproduction in any medium, provided you give appropriate credit to the original author(s) and the source, provide a link to the Creative Commons license, and indicate if changes were made.